This map depicts the racial distribution in Chicago, IL as of 2009. It was created by Bill Rankin in 2009 and was published in the Spring 2010 issue of the Yale School of Architecture journal, Prespecta. Each different colored dot represents a different ethnicity, and represents 25 people.

Blue: African Americans
Pink: Caucasians
Yellow: Hispanics
Green: Asians
This map is interesting because it gives a very clear image of how racially separated neighborhoods are in Chicago. There are distinct geographic areas in Chicago that are almost exclusively dominated by one race, most noticeably the south side being dominated by African Americans. This trend of racially dominated neighborhoods is replicated in many cities across the United States, and was very pronounced in Chicago during the early 20th century. Even today, these trends still exist as evidenced by the above map.
Website: http://www.urbagram.net/v1/revision/Shapefile?rev=0
MAP 2: World Population Distribution

This map was created at the University of Sheffield in 2009 and was published in The Telegraph in Europe. Instead of traditional map of the world, this map is based on population distribution. The size of countries on this map is determined by their population statistics as opposed to geographic area. One can see that the large yellow and green masses on the right of the map represent India and China respectively. While India isn't very large geographically, it boasts the second largest population of any country in the world, and therefore is depicted as large as it is above.
This map is interesting because is illustrates the world in a non-traditional way. One of the most interesting parts is how different Australia is. On this map, Australia is a much smaller mass, with the largest part being on the Eastern coast. This illustrates how relative to the world, Australia has a small population that is more heavily distributed on the East coast.
Website: http://www.telegraph.co.uk/news/uknews/6249395/Population-atlas-shows-world-in-a-new-light.html
MAP 3: Earthquake Risk in the United States
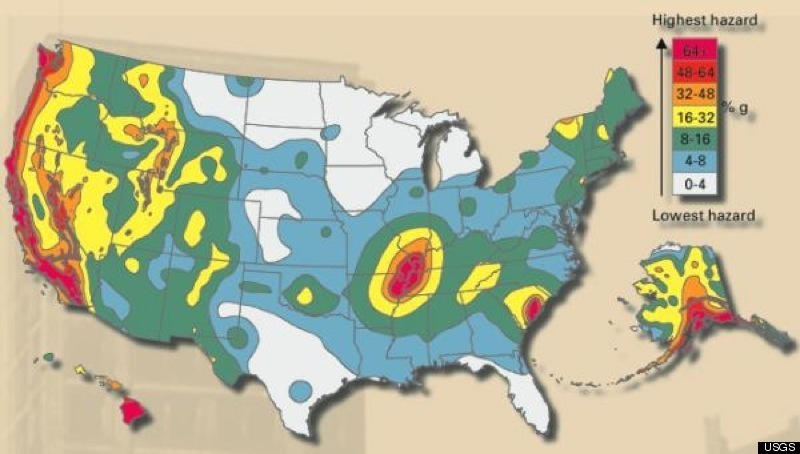
This map was created by the USGS and illustrates the risk of earthquakes across the United States. The data is based on fault lines and shows the highest risk being on the West Coast and Southern Alaska. Interestingly enough, the central US has a high risk for earthquakes as well. One can see that Southern California has an extremely high risk for earthquakes, due to the large number of faults running through this region.
Website: http://www.huffingtonpost.com/2010/01/22/us-fault-lines-graphic-ea_n_432948.html